The lockdown seems to be coming to an end (at least in England) and I’m now back at work full-time, but I still have a few more “Lessons from the lockdown” posts to post.
Today I’m looking at my utility (gas, electricity, water) usage and how it’s changed (or not) since the lockdown came in. I’ll stick the disclaimer up front: my meter readings are irregular and the data isn’t discrete enough to do a specific analysis by day/week, but it should show the general trends.
Gas
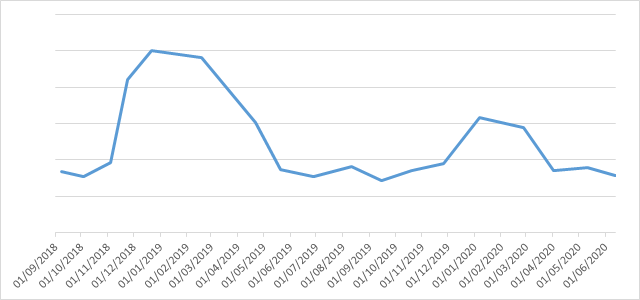
The most obvious thing in my gas usage over the last couple of years are the massive peaks over the winter period as I have a gas heating system. The lower usage last winter is either because I’ve had my flat much colder, or because the new double glazing actually does help to bring down heating costs.
The lockdown has coincided with a period of reasonably warm weather so I’ve had the heating turned off for a while. The only other use for gas is for cooking food on the hob. I have had to do more cooking whilst I’ve been at home, which may account for the slight recent rise and drop as I’ve gone back to work, but this is all within the realm of statistical anomalies. My current gas usage is almost at the lowest point it’s ever been (at this property anyway).
Electricity
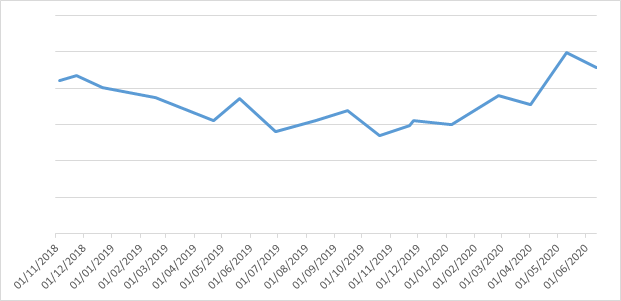
My electricity usage on the other hand has never been higher. Electricity usage is fairly non-seasonal, despite the longer winter evenings needing more lighting.
Generally just being at home and running more electrical devices has probably caused this massive spike. The massive ramp up in electricity usage recently coincides with both buying a new computer and being at home more to use it. The good news is that it appears to be dropping which could be linked to being back in the office more often, but only time will tell.
Water
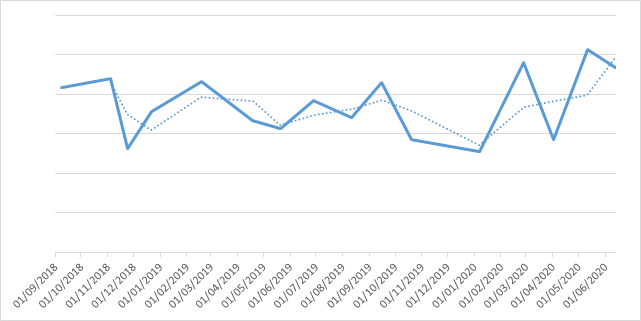
Water usage has fluctuated the most over the last couple of years. There is a definitive spike in usage during February/March this year, but then a massive drop before increasing again. It’s possible that some of these seemingly anomalous readings are caused by rounding errors when the meter is read. The actual usage is probably somewhere between the two peaks and the average trend is shown by the dotted line.
Either way there does seem to be an upward trend in water usage. With being at home more, there’s much more water being used than normal. From washing hands more often due to coronavirus, to the things I would normally do in the office (filling my water bottle, using the toilet etc), it’s not surprising that water use is higher than previously. Again, the good news is that the water usage seems to be on a downward trajectory too as I return to work.
One reply on “Lessons from the lockdown #4”
[…] mentioned last week that I’m no longer working from home, but am now back in the office all the time. Today […]