Last year, I wrote a post about how I had switched from using an annual travelcard to pay as you go for my public transport journeys. Well, it’s now time to look at how my travel in 2021 compared…
In 2021, I kept with the “pay as you go” approach and racked up a total of £1425.85 in journeys. That’s an increase over the £1354.30 in 2020 and is higher than the 1.6% average fares increase last year. A quick check shows I took 370 journeys in 2021 versus 322 in 2020. It’s more complicated though as different journeys have different prices and fare caps and so forth, but it does suggest that 2021 was definitely a year of being out and about more.
But what about comparing my pay as you go travel to the price of a travelcard? In 2021, a zone 1-4 travelcard (with a handful of additional journeys) would have cost me £2153.20. Therefore I saved over £700 by not taking that option. A wise choice and it looks like I’ll be sticking with it again this year.
Come back sometime next year and I’ll update on 2022 changes…
The news keeps telling us that inflation is high and the price of shopping is going up. But can we trust the media, and just how high? Well, I went through 8 months worth of grocery receipts to find out.
I should first point out that this is my personal inflation level and yours will depend very much on what you buy. Fortunately for this investigation, I generally always shop at the same place and buy a lot of the same items each shop.
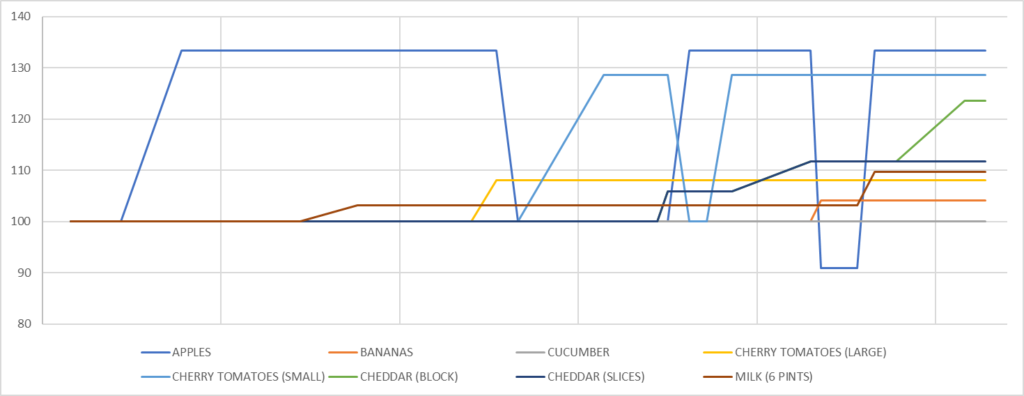
The dates themselves aren’t important, but the trends are. All items normalised to a starting value of 100% as of June 2021.
There’s some items I buy most shops and these are shown in the graph above. Bags of apples have fluctuated the most, varying between £1.10 and £1.60 over the last few months, probably because apples are often on sale. The next highest increase is for the small packs of cherry tomatoes which have gone up 28% (the large packs have only gone up 8%). The price of cheese also varies depending on what form it’s bought in. A 400g block of cheddar is now 23% more expensive than June last year, whilst packs of pre-sliced cheddar are only 11% more expensive. And 6 pints of semi-skimmed milk have gone up almost 10% in price, but 4 pint bottles have only gone up 5.5%.
Of my non-regular items, I discovered this week that 220g cans of Branston baked beans have gone up 37% after being stable for ages (was 40p per can, now 55p). In other big swings, wholewheat penne has gone up 27% from 55p per bag to 70p per bag.
Of fruit and vegetables, the only item which hasn’t changed price is cucumbers. Cucumbers have remained at a constant 43p for a standard non-large, non-organic cucumber. This is the same price as my local low-cost supermarket so I wonder if there’s some price competition going on here. (Loose onions have also stayed the same price, but I haven’t bought them for a while.)
And the one item that has come down in price is 1.25kg of sweet potatoes. Last June these cost £1.50 a bag, but they now cost just £1.11 a bag, a 24% reduction. And this one does have a sticker they’ve price-matched the low-cost supermarkets.
Long-life items such as cereal and toiletries appear to have remained relatively constant (or gone down), but I only buy these when they’re on offer and then I stock up for a while when I do, because that just makes sense. So fresh foods is really where the impact is going to be felt.
So is inflation real? Yes. How bad is it? Well, it depends entirely on what you buy (and in what packaging).
Full data (for items I’ve bought at least twice in the last 8 months):
Disclaimer: These prices are the most recent price I’ve paid, not necessarily their current prices.
Was
Now
Change
Apples (6x Royal Gala)
1.20
1.60
+33%
Bananas (Loose)
0.73/kg
0.76/kg
+4%
Baked beans (Branston 220g)*
0.40
0.55
+38%
Bacon (8 slices of back bacon)*
1.25
1.50
+20%
Branston pickle (small chunk)*
2.50
2.50
0%
Bread – Kingsmill 50/50 sliced
1.00
1.00
0%
Bread – Wholemeal seeded loaf
1.10
1.20
+9%
Cereal – Special K (Peach and Apricot)*
2.00
2.00
0%
Cereal – Raspberry and Yoghurt Crisp*
1.50
1.50
0%
Cereal – Shreddies*
3.00
3.00
0%
Cereal – Weetabix Mini (Chocolate)*
2.00
2.00
0%
Cheddar (400g)
1.70
2.10
+24%
Cheddar (10 slices)
1.70
1.90
+12%
Cherry tomatoes (330g)
0.70
0.90
+28%
Cherry tomatoes (500g)
1.25
1.35
+8%
Cucumber (whole)
0.43
0.43
0%
Deodorant*
1.46
1.75
+20%
Milk – Semi-skimmed (4 pints)
1.09
1.15
+6%
Milk – Semi-skimmed (6 pints)
1.55
1.70
+10%
Pasta – Wholewheat penne*
0.55
0.70
+27%
Onions (Loose)*
0.85/kg
0.85/kg
0%
Pasta bake sauce*
1.70
1.00
-41%
Shampoo*
3.50
3.50
0%
Shower gel*
2.20
1.25
-43%
Sweet potatoes (1.25kg)*
1.50
1.11
-24%
* Item bought infrequently or only when on offer so may not be accurate of complete trends.
This post is really a follow-up to last weeks. If you haven’t read that one, you might want to do that first.
One of the consequences of doing a lot of running is that my step count is massive. The recommended daily step target is generally around 10,000 steps. However, my Garmin watch works slightly differently and if the step count is hit one day, the target step count is increased the next day for a greater challenge. And the greater the step count is beaten by, the larger the increase (up to a limit). Conversely, if the step count isn’t beaten, the target drops. (There’s a good explanation of how it’s calculated here.)
My normal commute to and from work normally results in about 6000 steps, and I can easily get it to 8000 with a leg stretch at lunchtime. That obviously leaves me a bit short, but I often go for a run or can deliberately do some more walking to get to the target.
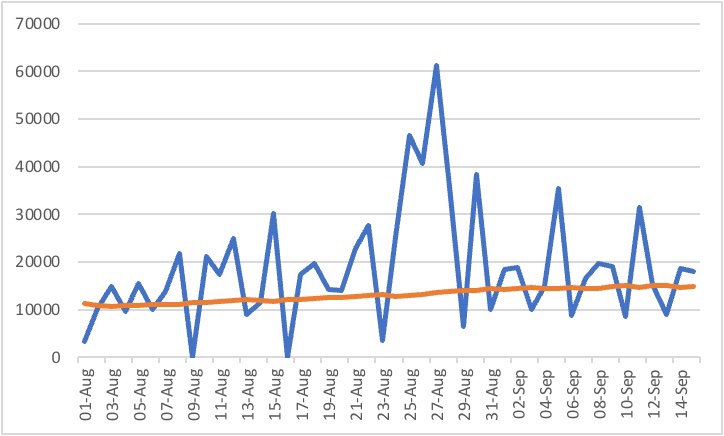
However, recently I’ve been doing so much running that my target is now at some of the highest target levels that I’ve seen. For example, my watch gave me a target of 14,870 steps for today. Which sounds like it may be a problem to reach, except that I went for a 6 mile run earlier which has taken me up to 17,951 steps for today.
The graph above shows my step count over the last few weeks (blue line) and my ever increasing step goal (orange line). It’s easy to see the days that I’ve not been out for a run (or been on a long walk). These are normally Mondays and Fridays as those are the rest days in my marathon training plan, but it does sometimes vary.
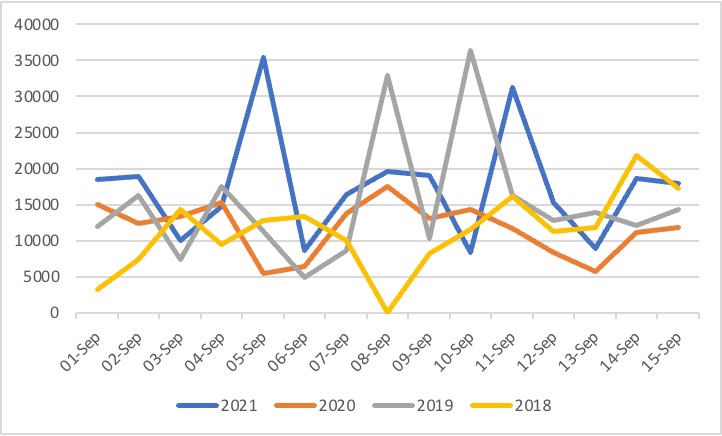
Here’s how my step count and target vary for the 15 September over the last few years:
2021 – Walked: 17951 – Target: 14870
2020 – Walked: 11879 – Target: 10200
2019 – Walked: 14279 – Target: 12060
2018 – Walked: 17281 – Target: 10570
So whilst the number of steps taken is fairly similar each year (at least for 15 September – maybe a different date would have been better to compare), the target number of steps is significantly higher this year which shows a much longer spate of meeting (or exceeding) the step goal over the last few weeks than I have previously. And that’s all because I’ve been doing so much running.
For completeness, here’s a graph showing the steps over the first half of September for the last few years. It’s not really very clear, but 2021 does have a higher average step count each day.
As I’ve mentioned before, I’m currently training to run the London Marathon, which is now less than four weeks away!
Because of that I’ve been doing a lot of running. A lot of running. More running than I’ve ever really done before. It’s quite hard to stress how much running I’ve actually been doing. This is my first marathon and it’s a lot more running than I’ve ever done before.
One thing people (people who have done marathons before) have consistently said is that marathon training plans are designed to make sure you can (and do) keep running, even when tired. I’ve also heard that a marathon is really like running for 20 miles and then running a 6 mile race on top of that. Either way, the aim is to get used to running on tired legs and then running a bit more. I’ve definitely felt that over the last couple of weeks.
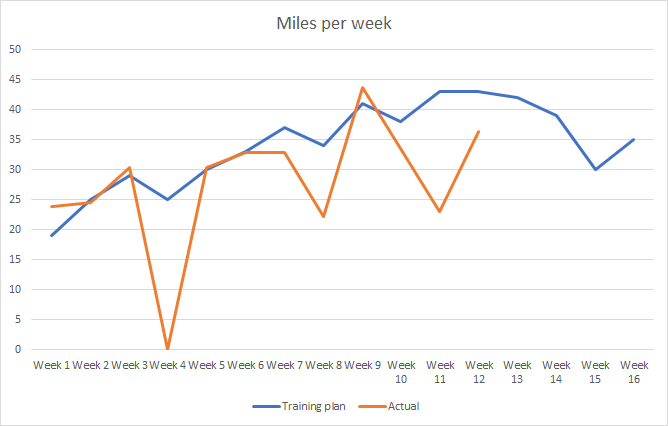
I’m currently in to week 13 of my training plan. I’ve just passed the longest run of 21 miles, although I still have a 20 mile long run this weekend. I thought that having passed the longest run, it would get easier now, but the blue line in the graph below shows that it actually levels out for a couple of weeks before the taper before the race.
We’re now in week 13 and I’ve felt that I’ve been doing a pretty good job of keeping up with the training plan, although looking at the chart, there are a lot of weeks where I’ve not been doing the mileage recommended.
Here’s why I think that is:
I don’t always run the suggested distance. I’ve been trying to get to my running club twice a week and their group running sessions haven’t always matched up with what the program suggests. However, the group sessions are normally comparable in effort/training benefit and so I just go with those.
I don’t always do every run. Each weekend in the training plan has a 3 mile run on the Saturday and a longer run on the Sunday. However, I don’t always have the capacity to fit in two runs on a weekend, so I prioritise the long run and sometimes miss out the 3 mile run.
I don’t always do the warm-up/cool-down. It’s probably quite bad, but I don’t always do them. And sometimes I do, but I don’t record it (or all of it) on my GPS watch.
I sometimes go walking. There’s a big drop in my running distance in weeks 4 and 11. In those weeks I walked 63 miles (in three days) and 79 miles (in five days) respectively. Whilst not running, I do feel that this sufficiently keeps the legs tired and hasn’t interfered with my training plan that much.
So, all in all, I feel like it’s actually all going really well. Although I am definitely getting tired of running and looking forward to when it’s all over! And there’s not that long to go now!
Over a year ago, I wrote a blog post on how my student loan amount had decreased in the ten years since I finished university. My plan was to not revisit the subject on this blog for another 7 years until it was paid off (assuming I’m still updating it by then). However…
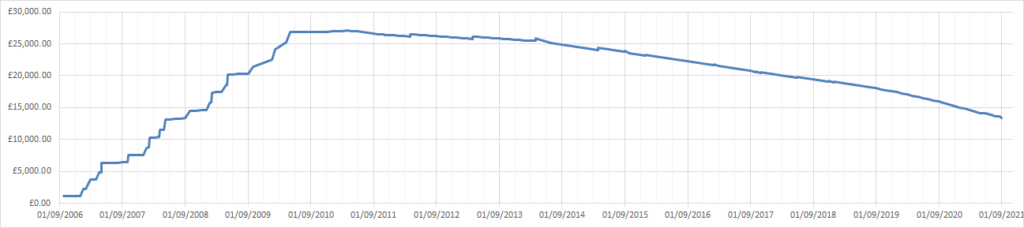
AS OF THIS WEEK I’VE NOW PAID OFF HALF OF MY STUDENT LOAN!!
It’s been almost 15 years since I started university and just under 10 and a half years since I started paying it off. I don’t have the exact numbers (because the website takes a few days to update) but I think I’ve now paid off £13,684.38, leaving me with around £13,371.67 to go.
(Note: some years have interest added monthly (where known), whereas other years only have interest added annually, therefore the slight increases each April can be ignored from the trends)
The next half should take much less time to pay off because that’s how interest rates work and also my salary is higher than it was when I first started working. Assuming that things stay the same as currently (interest rate and salary), I reckon I only have another 6 years to go…
And if you missed my previous post on what else I could have spent £27,000 on, you should go read that too.
I did three things this week that I haven’t done for a long time.
Firstly, I went to the pub for the first time since 15th October. Secondly, I went to the barbers for the first time since 13th October (a 183-day wait for a haircut compared to the 166-day wait between January and July last year). And thirdly I had to get cash out from a cash machine.
This is the first time I’ve had to get any cash out since December. I’ve not had much reason to spend cash though as the only thing I’ve had to buy with cash recently has been the occasional takeaway place that doesn’t take card. However the barber only takes cash and it’s easier to split a group beers bill with cash.
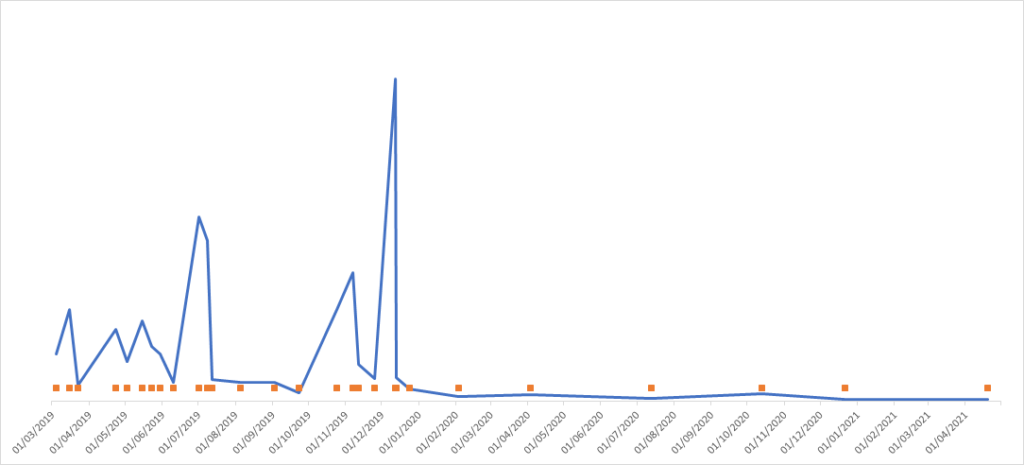
I’ve found all the times I’ve taken out cash over the last couple of years and plotted it into a graph:
The orange dots show each date I’ve taken out cash, whilst the blue line shows the amount averaged by the number of days until I next took out money (I don’t always take out the same amount each time but averaging it should make it comparable). The massive spike in December 2019 is for Christmas meals, because as I said, it’s always easier to sort group events with cash. And that was the last time I had any great need for cash.
Since then, my cash usage has dropped off massively and has been practically non-existent over the last few months. Maybe the cash usage will pick up again as things start to open up again and we can be more social, but maybe the days of using cash are over (other than for occasional beers and haircuts).
Whilst I was going through the data for last week’s post, I noticed that most of my journeys where travelling to or from work, particularly in 2020 when travelling for fun wasn’t allowed. It seems quite obvious that I’m now working from home more often. But in previous years I would have had more days out of the office: on training courses, on business trips, on leave (yes, I have taken some in 2020, but not as much as before). So just how many days do I normally spend in the office each year? To be clear, this is just talking about how many days I’ve been *in the office*, not how many days I’ve been *working*.
Some days it’s easy to tell when I went to the office, I made a morning peak journey in one direction, and an evening peak journey back in the other direction. Some days it’s more complicated as I come back a different route, or get off at a different station to walk a bit further, but it’s still generally obvious that I’ve been into the office. Other days it’s more complex as I’ve gone somewhere else after work, but I generally always head home afterwards. Although strangely I have travelled to work more times than I’ve come home, mainly as a result of occasionally running home instead. There’s also the possibility that I’ve travelled into the office and then gone elsewhere for the bulk of the day, and there’s a number of half days which I didn’t count specifically, but hopefully it should all balance out. Suffice it to say, these values are all very approximate.
I think there should be 222 possible days in the office per year (365 – 52 Saturdays – 52 Sundays – 8 bank holidays – 31 days leave). Yes, I’m ignoring leap years and that some years may have extra weekends or bank holidays. As I said this is approximate.
So, counting up all my journeys, here’s what I get:
Year
Days in office
% of working days in office
2014
210
94.6%
2015
191
86.0%
2016
204
91.9%
2017
207
93.2%
2018
182
82.0%
2019
178
80.2%
2020
153
68.9%
And whilst 2020 is lower than 2019, it’s not dramatically lower. But is quite a bit lower when compared to the high of 2014. It’s hard to tell if this is a general downwards trend, or is just related to some jobs/time periods having more business travel. For 2021 I’m currently at about 61% in the office, but given that we’re only six weeks into the year this could obviously go up or down before the end of the year.
And coming back to my initial reason for looking into this, I spent approximately 25% less last year on travel around London than in 2019, but I was only in the office 14% less than than the previous year. I’m not sure what the point behind those calculations is – I’m sure I could draw something else out, but that seems like enough for now.
But with a dataset of all my journeys for the last seven years there must be more that I can discover. What else would be interesting to know? My longest journey? My day with the most journeys? How many stations I’ve been to? Let me know in the comments.
Just over seven years ago, I moved to London. Before that I had always had houses and jobs that I could either walk or drive between. Now though, I had to get the train every day, and also to pay for it. I started off paying for each journey from my Oyster card top up balance, but in January 2014, I realised that I was topping up a lot and that it might make more sense to get an annual travelcard. The main advantage of a travelcard being that all journeys within the chosen zones would essentially be free, so the more journeys made, the better the saving.
So why is that relevant? Well, I’ve kept a record of every journey I’ve made, and every January I compare how much I would have spent on pay as you go versus how much I paid for the travelcard (plus the extra journeys outside my travelcard zones). Unfortunately I no longer have the exact statistics for the first few years, but in 2017 I saved £246.50 (and I think a few of the earlier years were even bigger savings).
2017 Travelcard
2017 PAYG
£1581.70
£1828.20
Fast forward to 2018 and I moved house from zone 3 to zone 4. Now, not only was the travelcard cost more, but there were fewer transport options so I was less likely to use public transport. The calculations were more complex because I moved halfway through the year, but I think I ended up spending £96.40 extra by having a travelcard and not making the most of the journeys.
2018 Travelcard
2018 PAYG
£1869.90
£1773.50
For 2019, I decided to renew my travelcard. Yes, I had lost some money the previous year, but it was complex with moving house, and maybe I would make more journeys this year. And so, in January 2020 I calculated how much I had spent the previous year, and unfortunately found that I overspent by £234 by having a travelcard.
2019 Travelcard
2019 PAYG
£2052.80
£1818.80
In order to confirm my calculations (there’s daily and weekly PAYG capping I hadn’t taken into account), I decided to do a three month trial of using pay as you go (though obviously on contactless now, rather than having to top up an oyster card) until the end of April 2020. But then COVID and lockdowns came in, so my three month trial ended up becoming a one year trial. With an increased number of days working from home and less travel away from London, it should be clear that PAYG was going to win this year, but by how much? A couple of weeks ago I calculated my travel costs for 2020…
2020 Travelcard
2020 PAYG
£2086.80
£1354.30
With a £732.50 saving, PAYG was a clear winner for 2020. I imagine it will still be the best option for the rest of this year until things get back to normal again. I’ll review this again next January, but at the moment, I can’t see a travelcard being a sensible option for me, at least until I can make a lot more journeys.
Having returned to work after my week off, I took in some biscuits as is customary after being away. Normally this is some sort of local delicacy from where you’ve been away to, but in this case, as I had been at home all week, it was just something from the supermarket on the way into the office. Anyway, it started a conversation with a colleague about how no-one has really been away at all this year, and particularly not overseas.
Looking back through my calendar for 2020, I’ve surprisingly been away for around 33 nights, which at 10% of the year seems very high. But the majority of those were in three distinct chunks with a large proportion of those nights being work related, and about a third were staying with family or friends.
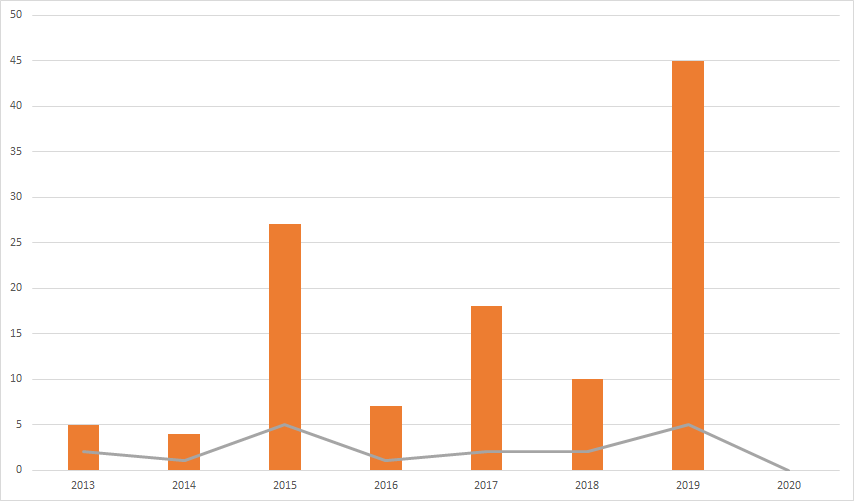
But none of those trips have been overseas, in fact I’ve not even left England this year. By my estimation, I should have travelled abroad 5 or 6 times this year, both for work and for fun. My travel has fluctuated over recent years, with a spike in 2015 and last year where I managed 5 trips abroad spending 45 days out of the country (although mostly for work). This is the first year in a long time where I’ve not been out of the country (I can’t remember what happened prior to 2013).
Number of days abroad (solid bars). Number of trips (line)
There’s still over a month of 2020 left, but it’s highly unlikely that I’ll be travelling abroad this year at all. Hopefully things will be back to normal for 2021…
Towards the end of August, I felt like I was in a bit of a rut and wanted to do something different. Chatting to a friend, he had read about a challenge to run 5km every day in September and suggested we both do it. He obviously ended up not even starting the challenge, but I did. And I finished it. (And I roped in my two brothers too along the way.) Here’s my thoughts on it:
Variety – Even before I started I knew that I would want some variety – variety in when I ran, and variety in where I ran. In the end, this turned out to not be so much of a problem due to my changing work schedule over the month, including being away for two of the weeks.
Planning routes – The challenge was to run at least 5km per day. I was thinking of doing some significantly longer runs in there too, but in the end I decided against this. I generally aimed to have runs between 5.1 and 5.5km in length since the GPS sometimes cuts off bits so I wanted to make sure I definitely hit the 5km and target, but didn’t want to exceed it needlessly. Having decided I would do a different route each day, this meant a lot of time spent planning where to run. My ideal route would be a single loop, starting and ending at the same point. I reckon I spent about 1 minute of planning a route for every 5 minutes of actual running. This obviously depended on the route, but some routes were much more complex. I also needed to have backup sections that I could add on if I hadn’t reached the 5km target when I thought I would (which did happen a couple of times). Only twice did I do an “out-and-back” run when I ran for 2.5km and then turned around.
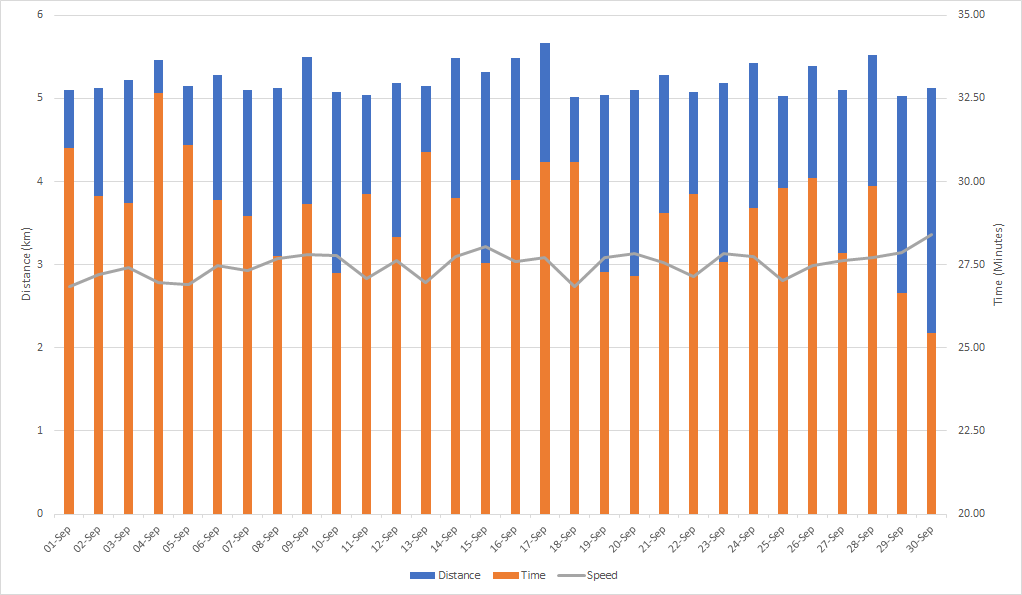
Distance – My total distance for the month was 156.77 km, which averages out at 5.23 km per day. My longest run was 5.66km whilst my shortest was 5.02km, but otherwise they mostly all fell into the 5.1-5.5km range.
Speed – My total running time for the month was 14 hours, 33 minutes and 10 seconds, with an average of 29 minutes and 6 seconds per run. But since the distances varied slightly, and the terrain and the routes varied every day it’s not possible to realistically compare them all. For example, one of the days I ran through a woodland at night time without a torch, so spent most of the run waving my arms in front of me to make sure I didn’t run into a tree. Knowing that I would have to run every day, I deliberately ran at a pace that was comfortable, rather than going full out (“marathon not a sprint”). Since none of my runs were races, there was also no incentive to actually run fast. My fastest run was one of the “out-and-backs” along a straight country road, which shows that turning corners and crossing other roads slows the pace down. My fastest run was on the final day, probably because I knew it was all over and I knew I didn’t have to run again the next day. [That’s what happens when you write a blog post with three days of activity left to do.]
Anyway, here’s it all plotted on a slightly complicated graph:
As can be seen, there’s not much of a trend across the month in terms of distance or time, other than a slightly above average length run is often followed by a slightly below average length run. The speed has also stayed fairly consistent across the month, although there is a potential increase towards the end of the month. This is probably because I knew what I was in for towards the end so I knew I could go a bit faster without having to pace myself for another 20-something days.
The hardest part wasn’t actually the running though. The hardest part wasn’t even finding the time to go for a run each day. The hardest part was probably actually having the motivation to go out running again each day. The weather was never particularly bad and the sunset/sunrise times were still reasonable, but it was sometimes a struggle to want to run again. Generally though, once I had started running it didn’t feel as bad.
Now that I’ve achieved this, am I pleased? Yes. Although I feel that I’m more pleased that I don’t have to run tomorrow. Was this the different thing in my life that I was looking for? Probably not, but it was fun to try. Will I do it again? No. Well, maybe. At least not until this is so far in the past that I’ve forgotten about how painful it was.