Categories
Money

Inflation

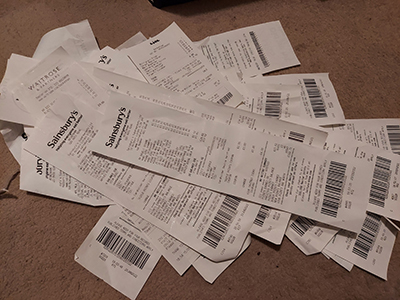
The news keeps telling us that inflation is high and the price of shopping is going up. But can we trust the media, and just how high? Well, I went through 8 months worth of grocery receipts to find out.

I should first point out that this is my personal inflation level and yours will depend very much on what you buy. Fortunately for this investigation, I generally always shop at the same place and buy a lot of the same items each shop.

The dates themselves aren’t important, but the trends are. All items normalised to a starting value of 100% as of June 2021.

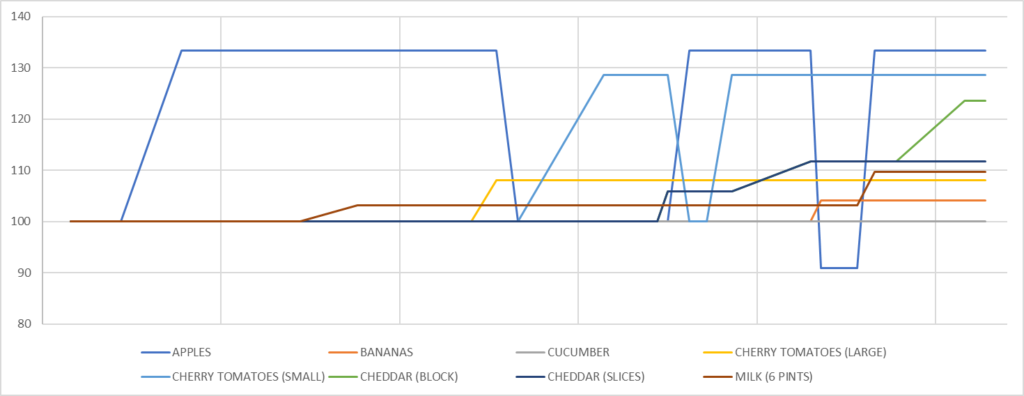
There’s some items I buy most shops and these are shown in the graph above. Bags of apples have fluctuated the most, varying between £1.10 and £1.60 over the last few months, probably because apples are often on sale. The next highest increase is for the small packs of cherry tomatoes which have gone up 28% (the large packs have only gone up 8%). The price of cheese also varies depending on what form it’s bought in. A 400g block of cheddar is now 23% more expensive than June last year, whilst packs of pre-sliced cheddar are only 11% more expensive. And 6 pints of semi-skimmed milk have gone up almost 10% in price, but 4 pint bottles have only gone up 5.5%.

Of my non-regular items, I discovered this week that 220g cans of Branston baked beans have gone up 37% after being stable for ages (was 40p per can, now 55p). In other big swings, wholewheat penne has gone up 27% from 55p per bag to 70p per bag.

Of fruit and vegetables, the only item which hasn’t changed price is cucumbers. Cucumbers have remained at a constant 43p for a standard non-large, non-organic cucumber. This is the same price as my local low-cost supermarket so I wonder if there’s some price competition going on here. (Loose onions have also stayed the same price, but I haven’t bought them for a while.)

And the one item that has come down in price is 1.25kg of sweet potatoes. Last June these cost £1.50 a bag, but they now cost just £1.11 a bag, a 24% reduction. And this one does have a sticker they’ve price-matched the low-cost supermarkets.

Long-life items such as cereal and toiletries appear to have remained relatively constant (or gone down), but I only buy these when they’re on offer and then I stock up for a while when I do, because that just makes sense. So fresh foods is really where the impact is going to be felt.

So is inflation real? Yes. How bad is it? Well, it depends entirely on what you buy (and in what packaging).


Full data (for items I’ve bought at least twice in the last 8 months):

Disclaimer: These prices are the most recent price I’ve paid, not necessarily their current prices.

WasNowChange
Apples (6x Royal Gala)1.201.60+33%
Bananas (Loose)0.73/kg0.76/kg+4%
Baked beans (Branston 220g)*0.400.55+38%
Bacon (8 slices of back bacon)*1.251.50+20%
Branston pickle (small chunk)*2.502.500%
Bread – Kingsmill 50/50 sliced1.001.000%
Bread – Wholemeal seeded loaf1.101.20+9%
Cereal – Special K (Peach and Apricot)*2.002.000%
Cereal – Raspberry and Yoghurt Crisp*1.501.500%
Cereal – Shreddies*3.003.000%
Cereal – Weetabix Mini (Chocolate)*2.002.000%
Cheddar (400g)1.702.10+24%
Cheddar (10 slices)1.701.90+12%
Cherry tomatoes (330g)0.700.90+28%
Cherry tomatoes (500g)1.251.35+8%
Cucumber (whole)0.430.430%
Deodorant*1.461.75+20%
Milk – Semi-skimmed (4 pints)1.091.15+6%
Milk – Semi-skimmed (6 pints)1.551.70+10%
Pasta – Wholewheat penne*0.550.70+27%
Onions (Loose)*0.85/kg0.85/kg0%
Pasta bake sauce*1.701.00-41%
Shampoo*3.503.500%
Shower gel*2.201.25-43%
Sweet potatoes (1.25kg)*1.501.11-24%
* Item bought infrequently or only when on offer so may not be accurate of complete trends.
Categories
Pondering

In the office

Whilst I was going through the data for last week’s post, I noticed that most of my journeys where travelling to or from work, particularly in 2020 when travelling for fun wasn’t allowed. It seems quite obvious that I’m now working from home more often. But in previous years I would have had more days out of the office: on training courses, on business trips, on leave (yes, I have taken some in 2020, but not as much as before). So just how many days do I normally spend in the office each year? To be clear, this is just talking about how many days I’ve been *in the office*, not how many days I’ve been *working*.

Some days it’s easy to tell when I went to the office, I made a morning peak journey in one direction, and an evening peak journey back in the other direction. Some days it’s more complicated as I come back a different route, or get off at a different station to walk a bit further, but it’s still generally obvious that I’ve been into the office. Other days it’s more complex as I’ve gone somewhere else after work, but I generally always head home afterwards. Although strangely I have travelled to work more times than I’ve come home, mainly as a result of occasionally running home instead. There’s also the possibility that I’ve travelled into the office and then gone elsewhere for the bulk of the day, and there’s a number of half days which I didn’t count specifically, but hopefully it should all balance out. Suffice it to say, these values are all very approximate.

I think there should be 222 possible days in the office per year (365 – 52 Saturdays – 52 Sundays – 8 bank holidays – 31 days leave). Yes, I’m ignoring leap years and that some years may have extra weekends or bank holidays. As I said this is approximate.

So, counting up all my journeys, here’s what I get:

YearDays in
office
% of working
days in office
201421094.6%
201519186.0%
201620491.9%
201720793.2%
201818282.0%
201917880.2%
202015368.9%

And whilst 2020 is lower than 2019, it’s not dramatically lower. But is quite a bit lower when compared to the high of 2014. It’s hard to tell if this is a general downwards trend, or is just related to some jobs/time periods having more business travel. For 2021 I’m currently at about 61% in the office, but given that we’re only six weeks into the year this could obviously go up or down before the end of the year.

And coming back to my initial reason for looking into this, I spent approximately 25% less last year on travel around London than in 2019, but I was only in the office 14% less than than the previous year. I’m not sure what the point behind those calculations is – I’m sure I could draw something else out, but that seems like enough for now.

But with a dataset of all my journeys for the last seven years there must be more that I can discover. What else would be interesting to know? My longest journey? My day with the most journeys? How many stations I’ve been to? Let me know in the comments.

Categories
Discussion

Travel 2020

Having returned to work after my week off, I took in some biscuits as is customary after being away. Normally this is some sort of local delicacy from where you’ve been away to, but in this case, as I had been at home all week, it was just something from the supermarket on the way into the office. Anyway, it started a conversation with a colleague about how no-one has really been away at all this year, and particularly not overseas.

Looking back through my calendar for 2020, I’ve surprisingly been away for around 33 nights, which at 10% of the year seems very high. But the majority of those were in three distinct chunks with a large proportion of those nights being work related, and about a third were staying with family or friends.

But none of those trips have been overseas, in fact I’ve not even left England this year. By my estimation, I should have travelled abroad 5 or 6 times this year, both for work and for fun. My travel has fluctuated over recent years, with a spike in 2015 and last year where I managed 5 trips abroad spending 45 days out of the country (although mostly for work). This is the first year in a long time where I’ve not been out of the country (I can’t remember what happened prior to 2013).

Number of days abroad (solid bars). Number of trips (line)

There’s still over a month of 2020 left, but it’s highly unlikely that I’ll be travelling abroad this year at all. Hopefully things will be back to normal for 2021…

Categories
Pondering

Supermarket savings

I recently got a loyalty card for my local supermarket. As a reward, they sent me some vouchers off either shopping or petrol (on alternate weeks) if I spent £20 per week over 4 consecutive weeks. If I spent all 4 vouchers, there would even be some bonus points.

Having used some of these vouchers, they then sent me some more vouchers if I spent £30 per week over the next 6 weeks. This felt like a very sneaky way to get me to spend more money. Were they trying to get more money out of me? Would spending more money actually result in bigger savings? I decided to try and find out…