Last year, I wrote a post about how I had switched from using an annual travelcard to pay as you go for my public transport journeys. Well, it’s now time to look at how my travel in 2021 compared…
In 2021, I kept with the “pay as you go” approach and racked up a total of £1425.85 in journeys. That’s an increase over the £1354.30 in 2020 and is higher than the 1.6% average fares increase last year. A quick check shows I took 370 journeys in 2021 versus 322 in 2020. It’s more complicated though as different journeys have different prices and fare caps and so forth, but it does suggest that 2021 was definitely a year of being out and about more.
But what about comparing my pay as you go travel to the price of a travelcard? In 2021, a zone 1-4 travelcard (with a handful of additional journeys) would have cost me £2153.20. Therefore I saved over £700 by not taking that option. A wise choice and it looks like I’ll be sticking with it again this year.
Come back sometime next year and I’ll update on 2022 changes…
The news keeps telling us that inflation is high and the price of shopping is going up. But can we trust the media, and just how high? Well, I went through 8 months worth of grocery receipts to find out.
I should first point out that this is my personal inflation level and yours will depend very much on what you buy. Fortunately for this investigation, I generally always shop at the same place and buy a lot of the same items each shop.
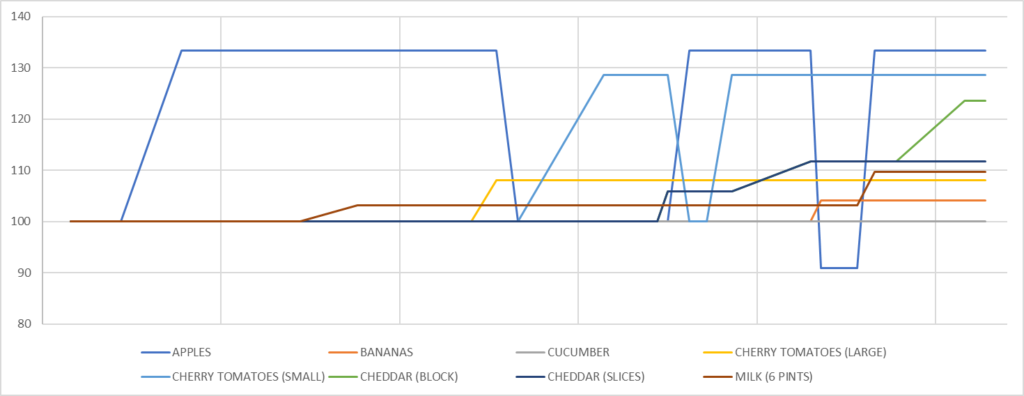
The dates themselves aren’t important, but the trends are. All items normalised to a starting value of 100% as of June 2021.
There’s some items I buy most shops and these are shown in the graph above. Bags of apples have fluctuated the most, varying between £1.10 and £1.60 over the last few months, probably because apples are often on sale. The next highest increase is for the small packs of cherry tomatoes which have gone up 28% (the large packs have only gone up 8%). The price of cheese also varies depending on what form it’s bought in. A 400g block of cheddar is now 23% more expensive than June last year, whilst packs of pre-sliced cheddar are only 11% more expensive. And 6 pints of semi-skimmed milk have gone up almost 10% in price, but 4 pint bottles have only gone up 5.5%.
Of my non-regular items, I discovered this week that 220g cans of Branston baked beans have gone up 37% after being stable for ages (was 40p per can, now 55p). In other big swings, wholewheat penne has gone up 27% from 55p per bag to 70p per bag.
Of fruit and vegetables, the only item which hasn’t changed price is cucumbers. Cucumbers have remained at a constant 43p for a standard non-large, non-organic cucumber. This is the same price as my local low-cost supermarket so I wonder if there’s some price competition going on here. (Loose onions have also stayed the same price, but I haven’t bought them for a while.)
And the one item that has come down in price is 1.25kg of sweet potatoes. Last June these cost £1.50 a bag, but they now cost just £1.11 a bag, a 24% reduction. And this one does have a sticker they’ve price-matched the low-cost supermarkets.
Long-life items such as cereal and toiletries appear to have remained relatively constant (or gone down), but I only buy these when they’re on offer and then I stock up for a while when I do, because that just makes sense. So fresh foods is really where the impact is going to be felt.
So is inflation real? Yes. How bad is it? Well, it depends entirely on what you buy (and in what packaging).
Full data (for items I’ve bought at least twice in the last 8 months):
Disclaimer: These prices are the most recent price I’ve paid, not necessarily their current prices.
Was
Now
Change
Apples (6x Royal Gala)
1.20
1.60
+33%
Bananas (Loose)
0.73/kg
0.76/kg
+4%
Baked beans (Branston 220g)*
0.40
0.55
+38%
Bacon (8 slices of back bacon)*
1.25
1.50
+20%
Branston pickle (small chunk)*
2.50
2.50
0%
Bread – Kingsmill 50/50 sliced
1.00
1.00
0%
Bread – Wholemeal seeded loaf
1.10
1.20
+9%
Cereal – Special K (Peach and Apricot)*
2.00
2.00
0%
Cereal – Raspberry and Yoghurt Crisp*
1.50
1.50
0%
Cereal – Shreddies*
3.00
3.00
0%
Cereal – Weetabix Mini (Chocolate)*
2.00
2.00
0%
Cheddar (400g)
1.70
2.10
+24%
Cheddar (10 slices)
1.70
1.90
+12%
Cherry tomatoes (330g)
0.70
0.90
+28%
Cherry tomatoes (500g)
1.25
1.35
+8%
Cucumber (whole)
0.43
0.43
0%
Deodorant*
1.46
1.75
+20%
Milk – Semi-skimmed (4 pints)
1.09
1.15
+6%
Milk – Semi-skimmed (6 pints)
1.55
1.70
+10%
Pasta – Wholewheat penne*
0.55
0.70
+27%
Onions (Loose)*
0.85/kg
0.85/kg
0%
Pasta bake sauce*
1.70
1.00
-41%
Shampoo*
3.50
3.50
0%
Shower gel*
2.20
1.25
-43%
Sweet potatoes (1.25kg)*
1.50
1.11
-24%
* Item bought infrequently or only when on offer so may not be accurate of complete trends.
Over a year ago, I wrote a blog post on how my student loan amount had decreased in the ten years since I finished university. My plan was to not revisit the subject on this blog for another 7 years until it was paid off (assuming I’m still updating it by then). However…
AS OF THIS WEEK I’VE NOW PAID OFF HALF OF MY STUDENT LOAN!!
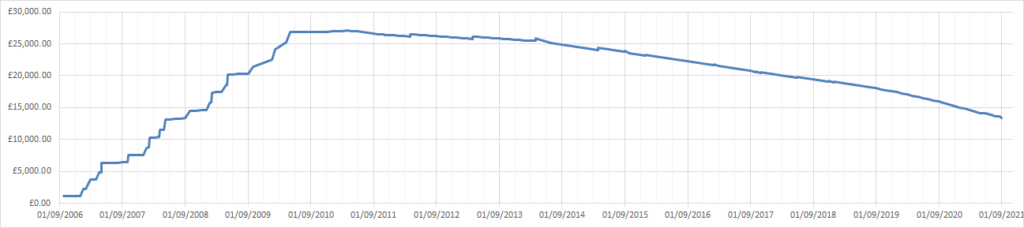
It’s been almost 15 years since I started university and just under 10 and a half years since I started paying it off. I don’t have the exact numbers (because the website takes a few days to update) but I think I’ve now paid off £13,684.38, leaving me with around £13,371.67 to go.
(Note: some years have interest added monthly (where known), whereas other years only have interest added annually, therefore the slight increases each April can be ignored from the trends)
The next half should take much less time to pay off because that’s how interest rates work and also my salary is higher than it was when I first started working. Assuming that things stay the same as currently (interest rate and salary), I reckon I only have another 6 years to go…
And if you missed my previous post on what else I could have spent £27,000 on, you should go read that too.
I did three things this week that I haven’t done for a long time.
Firstly, I went to the pub for the first time since 15th October. Secondly, I went to the barbers for the first time since 13th October (a 183-day wait for a haircut compared to the 166-day wait between January and July last year). And thirdly I had to get cash out from a cash machine.
This is the first time I’ve had to get any cash out since December. I’ve not had much reason to spend cash though as the only thing I’ve had to buy with cash recently has been the occasional takeaway place that doesn’t take card. However the barber only takes cash and it’s easier to split a group beers bill with cash.
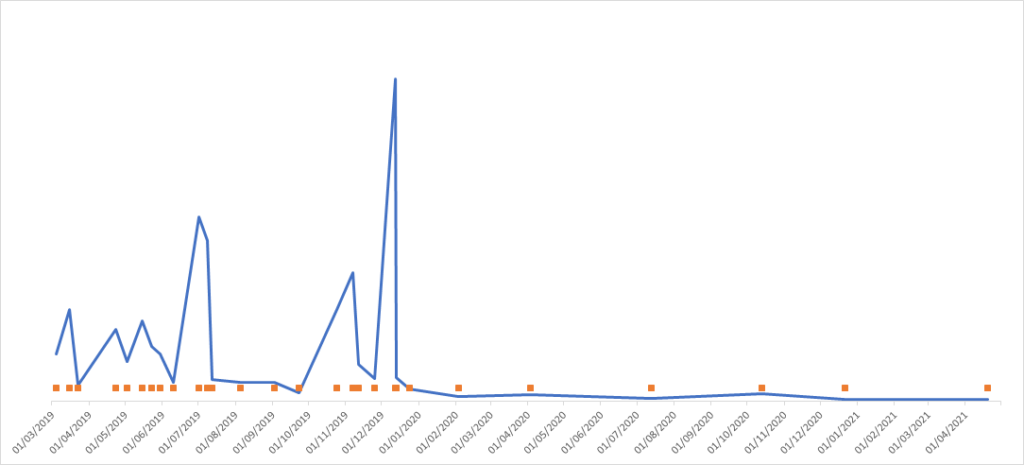
I’ve found all the times I’ve taken out cash over the last couple of years and plotted it into a graph:
The orange dots show each date I’ve taken out cash, whilst the blue line shows the amount averaged by the number of days until I next took out money (I don’t always take out the same amount each time but averaging it should make it comparable). The massive spike in December 2019 is for Christmas meals, because as I said, it’s always easier to sort group events with cash. And that was the last time I had any great need for cash.
Since then, my cash usage has dropped off massively and has been practically non-existent over the last few months. Maybe the cash usage will pick up again as things start to open up again and we can be more social, but maybe the days of using cash are over (other than for occasional beers and haircuts).
Just over seven years ago, I moved to London. Before that I had always had houses and jobs that I could either walk or drive between. Now though, I had to get the train every day, and also to pay for it. I started off paying for each journey from my Oyster card top up balance, but in January 2014, I realised that I was topping up a lot and that it might make more sense to get an annual travelcard. The main advantage of a travelcard being that all journeys within the chosen zones would essentially be free, so the more journeys made, the better the saving.
So why is that relevant? Well, I’ve kept a record of every journey I’ve made, and every January I compare how much I would have spent on pay as you go versus how much I paid for the travelcard (plus the extra journeys outside my travelcard zones). Unfortunately I no longer have the exact statistics for the first few years, but in 2017 I saved £246.50 (and I think a few of the earlier years were even bigger savings).
2017 Travelcard
2017 PAYG
£1581.70
£1828.20
Fast forward to 2018 and I moved house from zone 3 to zone 4. Now, not only was the travelcard cost more, but there were fewer transport options so I was less likely to use public transport. The calculations were more complex because I moved halfway through the year, but I think I ended up spending £96.40 extra by having a travelcard and not making the most of the journeys.
2018 Travelcard
2018 PAYG
£1869.90
£1773.50
For 2019, I decided to renew my travelcard. Yes, I had lost some money the previous year, but it was complex with moving house, and maybe I would make more journeys this year. And so, in January 2020 I calculated how much I had spent the previous year, and unfortunately found that I overspent by £234 by having a travelcard.
2019 Travelcard
2019 PAYG
£2052.80
£1818.80
In order to confirm my calculations (there’s daily and weekly PAYG capping I hadn’t taken into account), I decided to do a three month trial of using pay as you go (though obviously on contactless now, rather than having to top up an oyster card) until the end of April 2020. But then COVID and lockdowns came in, so my three month trial ended up becoming a one year trial. With an increased number of days working from home and less travel away from London, it should be clear that PAYG was going to win this year, but by how much? A couple of weeks ago I calculated my travel costs for 2020…
2020 Travelcard
2020 PAYG
£2086.80
£1354.30
With a £732.50 saving, PAYG was a clear winner for 2020. I imagine it will still be the best option for the rest of this year until things get back to normal again. I’ll review this again next January, but at the moment, I can’t see a travelcard being a sensible option for me, at least until I can make a lot more journeys.
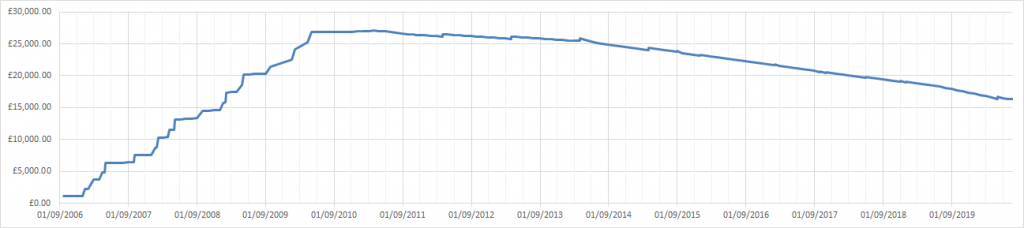
Somehow it’s been 10 years since I finished university. With this week’s news about the new student loan repayment tool, I thought I would write a post looking at my student loan repayment over this time (Disclaimer: I actually started writing this post weeks ago, it’s just fortuitous that it’s in the news at the same time).
I started university in 2006, the first year that the (then) new and ridiculously expensive tuition fees of £3000/year came in. For a four year course, this amounted to £12,000. I also received the maintenance loan at another £3000/year. In fact, each year was slightly higher than the previous year because of inflation, and on top of this, interest was added from day 1, so that by the time I graduated, I owed £26,823.07.
This doesn’t start getting paid back until the April after graduation, so when I did start paying it off, it had reached a total of £27,056.05.
The repayments are based on a percentage over a certain earning amount. As a recent graduate, my starting salary wasn’t especially high and so my first repayment in April 2011 was £52. And whilst I don’t have the exact figure, the loan gained approximately £35 in interest that month. This certainly wasn’t going to be quick to repay.
(Note: some years have interest added monthly (where known), whereas other years only have interest added annually, therefore the slight increases each April can be ignored from the trends)
Fast forward 9 and a bit years from when I started repaying and (as of today) I’m down to only owing £16,365.82. By my estimation that’s around 40% paid. At the current repayment amounts and interest rates I should be paid off in just under 7 and a half more years.
Having produced a graph of the amount owed over time, I was hoping it would highlight some really interesting trends but there’s not really much to say about it. For the first couple of years, the repayments were only slightly higher than the interest gained and so the total mostly flat-lined. Increased wages (most noticeable in early 2014) have caused the total to decrease quicker. There have been some drops (and rises) in the interest rate and in the earnings threshold too, but these have been relatively small and have had less impact on how quickly it’s paid off (possibly balanced out by salary inflation?). Without any major increases to my salary or the interest rate (both fairly unlikely), the downwards trend should continue at its current rate.
What does seem sure (at least at the moment) is that I’m not going to get to the 25 year point where any outstanding debt is written off. Come back in another 7 years and 4 months to see how things have gone.
The other day I received a nice letter from the Students Loans Company (or whatever they’re called these days) reminding me that I now owe £27,056.05 on my student loan.
And it got me thinking.
I spent this money on four years at university and the ability to put the letters “MEng” after my name, but what else could I have spent it on? I had a quick look.
A second-hand armour plated jaguar (From £25k+VAT). I would love one purely to say that I owned a bullet-proof car. In fact, I might get this one anyway.
A meeting with Nick Clegg (£25k/year). This one I will pass on, and not just because it’s an annual fee.
A 1 bed house in Manchester (£25k). It’s already been reduced by £22k, but it’s quite possibly the ugliest house I’ve seen. (Does it have any windows?)
A lock of Justin Bieber’s hair (£25k). Too late for this one, it was sold last month and no doubt it’ll cost more when it’s back on the market.
What have I missed? What would/could you have spent this money on?