Categories
Money

Student loans

Somehow it’s been 10 years since I finished university. With this week’s news about the new student loan repayment tool, I thought I would write a post looking at my student loan repayment over this time (Disclaimer: I actually started writing this post weeks ago, it’s just fortuitous that it’s in the news at the same time).

I started university in 2006, the first year that the (then) new and ridiculously expensive tuition fees of £3000/year came in. For a four year course, this amounted to £12,000. I also received the maintenance loan at another £3000/year. In fact, each year was slightly higher than the previous year because of inflation, and on top of this, interest was added from day 1, so that by the time I graduated, I owed £26,823.07.

This doesn’t start getting paid back until the April after graduation, so when I did start paying it off, it had reached a total of £27,056.05.

The repayments are based on a percentage over a certain earning amount. As a recent graduate, my starting salary wasn’t especially high and so my first repayment in April 2011 was £52. And whilst I don’t have the exact figure, the loan gained approximately £35 in interest that month. This certainly wasn’t going to be quick to repay.

(Note: some years have interest added monthly (where known), whereas other years only have interest added annually, therefore the slight increases each April can be ignored from the trends)

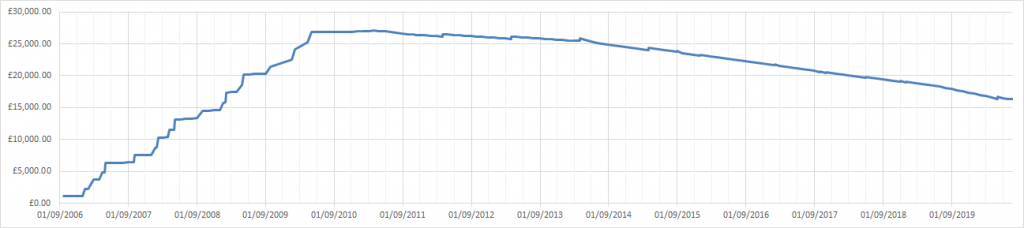
Fast forward 9 and a bit years from when I started repaying and (as of today) I’m down to only owing £16,365.82. By my estimation that’s around 40% paid. At the current repayment amounts and interest rates I should be paid off in just under 7 and a half more years.

Having produced a graph of the amount owed over time, I was hoping it would highlight some really interesting trends but there’s not really much to say about it. For the first couple of years, the repayments were only slightly higher than the interest gained and so the total mostly flat-lined. Increased wages (most noticeable in early 2014) have caused the total to decrease quicker. There have been some drops (and rises) in the interest rate and in the earnings threshold too, but these have been relatively small and have had less impact on how quickly it’s paid off (possibly balanced out by salary inflation?). Without any major increases to my salary or the interest rate (both fairly unlikely), the downwards trend should continue at its current rate.

What does seem sure (at least at the moment) is that I’m not going to get to the 25 year point where any outstanding debt is written off. Come back in another 7 years and 4 months to see how things have gone.

Categories
Miscellaneous

Running along

After thinking about it for a long time, last week I finally got round to replacing my old running shoes (I had been waiting for shops to reopen, but I went online in the end).

In the fifteen months I had these shoes I ran just under 1200km*. That’s way, way over the recommendation of replacing running shoes after 500-800km. My usage averages out to about 2.3km per day. Obviously I didn’t run every day – some days I ran more and some days I didn’t run at all.

*I’m not sure this is quite right as there’s some activities which I wouldn’t have used these shoes for but are recorded with them. Conversely, not all my runs get recorded so it may balance out. Anyway, it still shows I went way over the recommended usage limits.

Distance (in km) against time

There’s a few interesting trends to pick out from this data:

  1. It’s possible to see where I had big races in my schedule. I ran half marathons (21km) in March 2019 (the Big Half), September 2019 (the Great North Run) and early March 2020 (the Big Half again). These all show as an increase in training over the proceeding weeks (more distance covered), a small step increase for the race and then a reduced mileage afterwards.
  2. I also ran a half marathon in August 2019 (the Thames Meander Half Marathon) which again shows as a small step increase, but this was part of my training for the Great North Run so doesn’t have it’s own associated training increase/decrease either side.
  3. I appear to have taken a fairly long break from running in March-April 2019. This was partly from resting after the previous race, but also mainly because I was out of the country. I had taken an older pair of shoes to save on weight (not because my older shoes were lighter, but because I could use them for non-running purposes too – something I wouldn’t do in my almost new shoes).
  4. I also ran less in December 2019-early January 2020. I had a cold/illness at this point (even if my family didn’t believe me) and I didn’t feel like running for most of the Christmas period.
  5. Since the most recent race at the beginning of March, and during the lockdown, there’s been a steady stream of runs, some slightly longer ones but balanced out by some extra rest days. Without any races planned, I guess that’s what my regular running pattern looks like (i.e. when not training for a race and not resting after one).

Anyway, after almost 1200km and four half marathons, it was definitely time for them to be replaced. Time to see how their replacements hold up…